
The Revenue report shows how gross sales become total sales, and where your revenue comes from.
Go to WooCommerce → Deep Insights → Revenue.
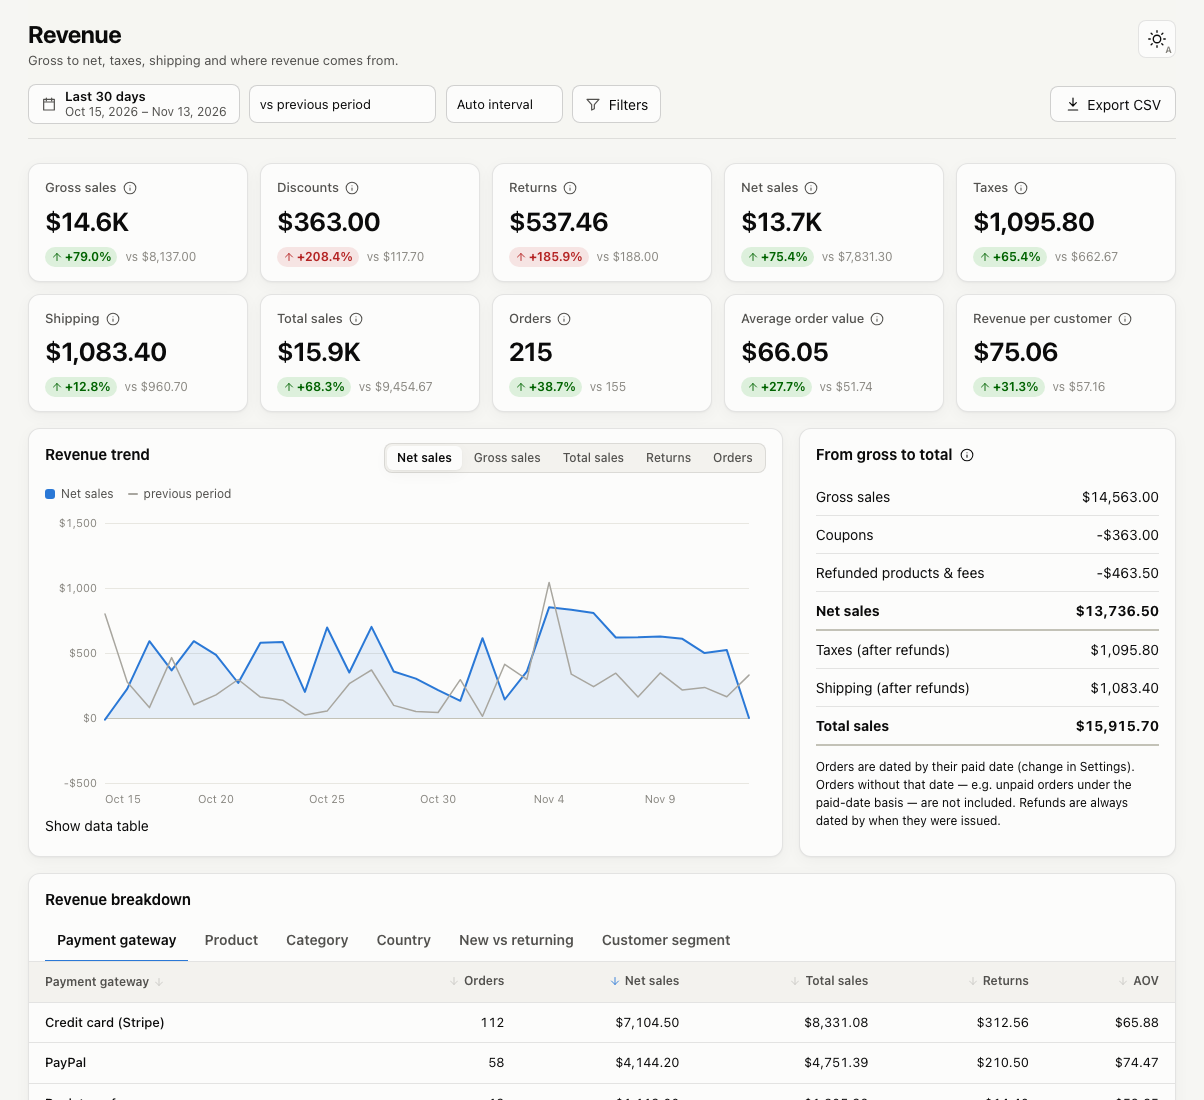
Metrics
- Gross sales: product sales before coupons and refunds, excluding tax and shipping.
- Discounts: coupon discounts, excluding tax.
- Returns: refunded amounts, including tax and shipping, counted on the refund date.
- Net sales: gross sales minus coupons and refunded products and fees. Fees are included.
- Taxes: order tax (including shipping tax) minus refunded tax.
- Shipping: shipping charged, excluding tax, minus refunded shipping.
- Total sales: net sales + taxes + shipping. This is what customers paid, after refunds.
- Orders: counted orders in the date range.
- Average order value: order net sales divided by orders. Refunds are not deducted, as in WooCommerce.
- Revenue per customer: net sales divided by the number of customers who ordered.
These figures match WooCommerce Analytics → Revenue for the same dates and settings. See why numbers can differ for the few exceptions.
Revenue trend
The chart shows net sales, gross sales, total sales, returns or orders over time. The grey line is the comparison period.
Net sales can dip below zero on a day when refunds were larger than new sales.
From gross to total
This card walks from gross sales to total sales step by step: coupons, refunded products and fees, taxes and shipping.
Revenue breakdown
The breakdown table splits revenue by:
- Payment gateway
- Product
- Category
- Country
- New vs returning customers
- Customer segment
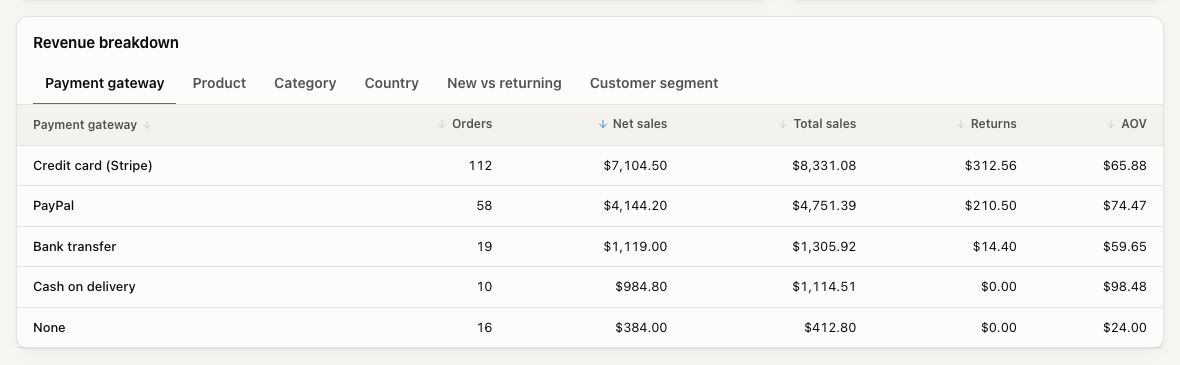
Each row shows orders, net sales, total sales, returns and average order value.