
Every report shares the same controls at the top of the page. Your choices carry over as you move between reports.
Date range
Click the date button to pick a preset or a custom range.
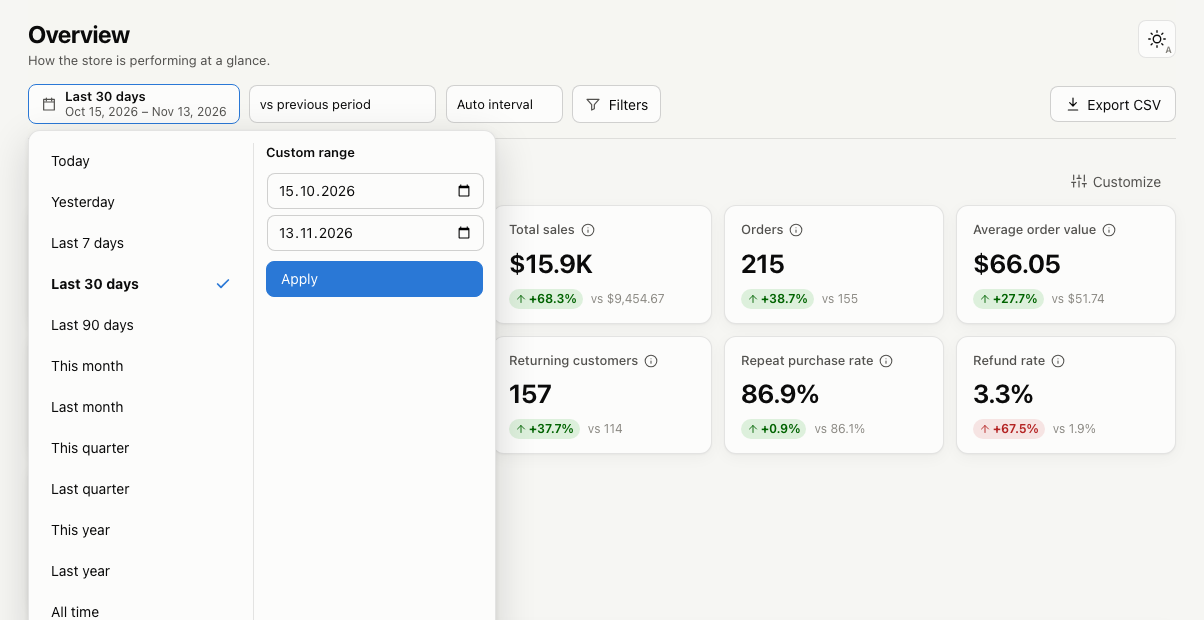
Presets: Today, Yesterday, Last 7 days, Last 30 days, Last 90 days, This month, Last month, This quarter, Last quarter, This year, Last year and All time.
Dates use your store’s timezone (Settings → General in WordPress).
By default, an order belongs to the date it was paid, the same as WooCommerce Analytics. You can change this to the created or completed date in Settings. Refunds always count on the date they were issued.
Comparison
The second control compares the selected range with:
- Previous period: the same number of days just before the range.
- Same period last year
- No comparison
Each figure then shows the change, for example “+12.4% vs $8,137.00”. Green means the change is good for the business and red means it is not, so a rising refund rate shows in red.
Interval
Charts group data by day, week, month, quarter or year. Auto interval picks a sensible one for the range. Weeks start on the day set in Settings → General → Week Starts On.
Filters
Click Filters to narrow every report on the page.
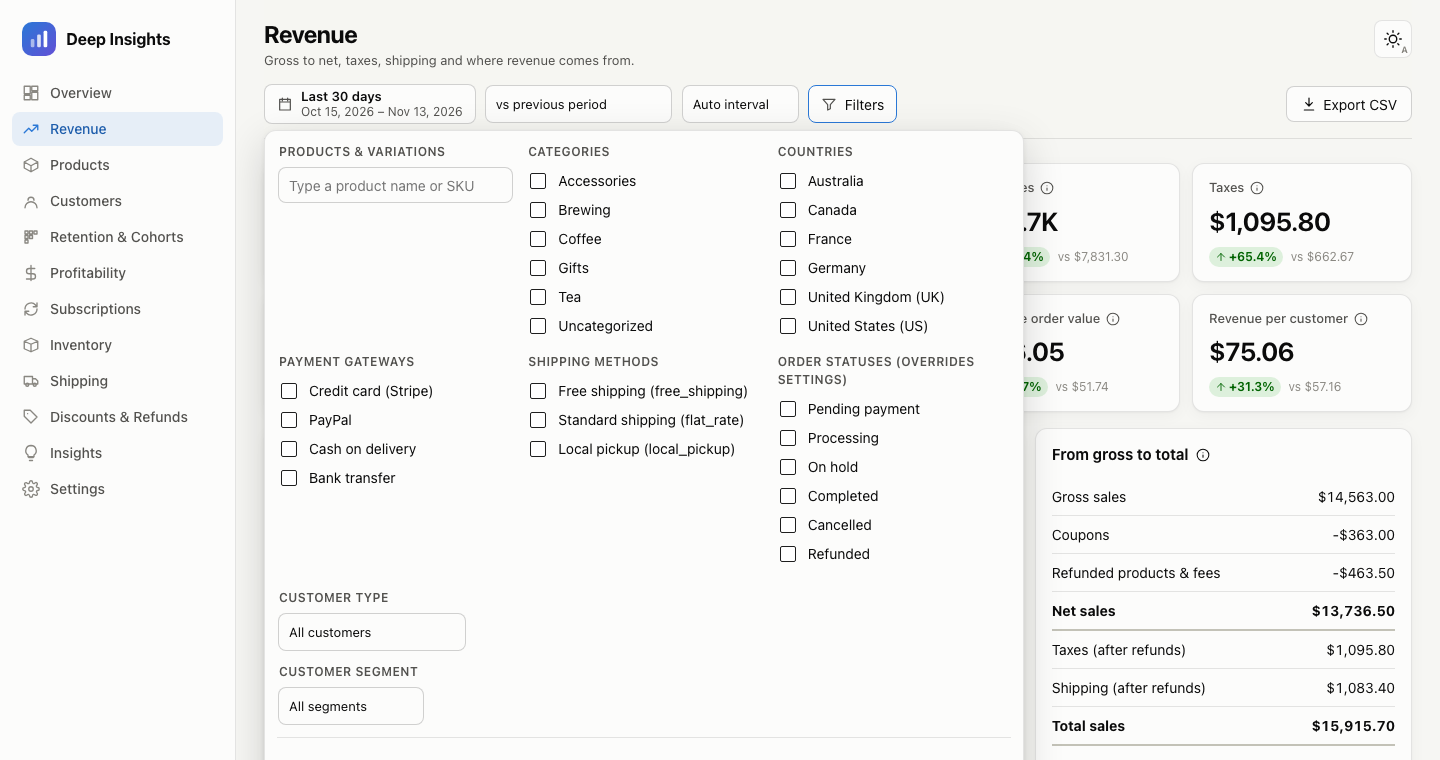
You can filter by:
- Products and variations (search by name or SKU)
- Categories (includes subcategories)
- Countries
- Payment gateways
- Shipping methods
- Order statuses (overrides the counted statuses in Settings)
- Customer type: new, returning, registered accounts or guests
- Customer segment (RFM)
A number on the Filters button shows how many filters are active. Use Clear all to remove them.
When you filter order-level reports by a product or category, Deep Insights includes the whole order for every order that contains it. Product reports count only the matching lines.
Currency
If your store has taken orders in more than one currency, a currency selector appears. Deep Insights never converts or adds currencies together; each currency is reported separately.
Customize the Overview
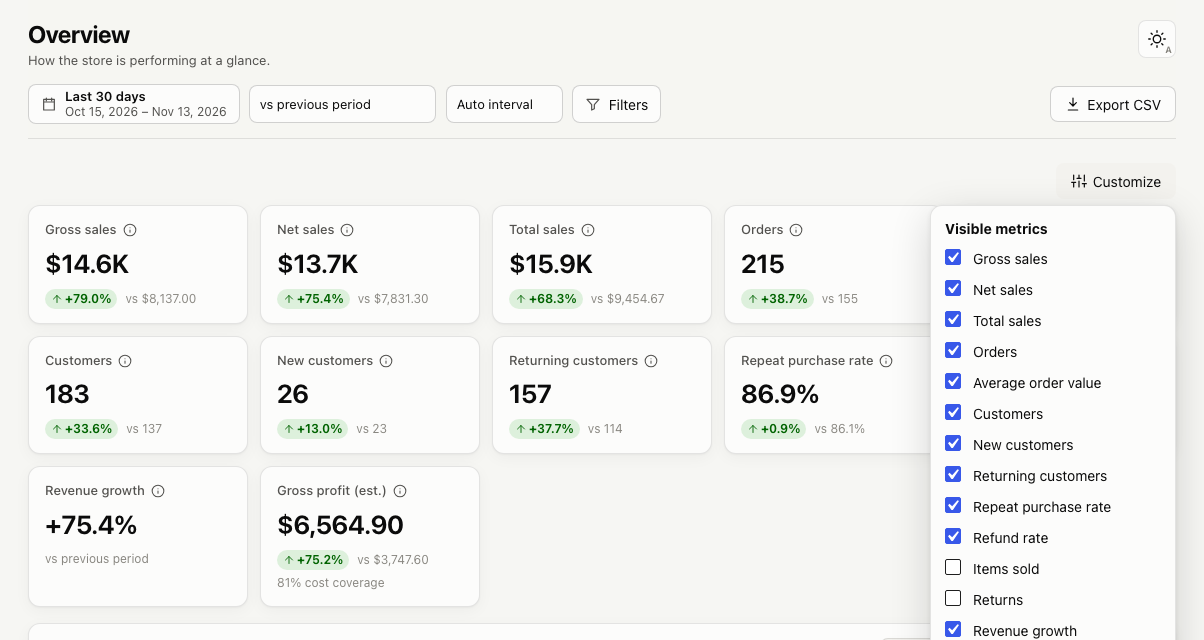
On the Overview page, click Customize to choose which metric cards appear. Your choice is saved to your user account.
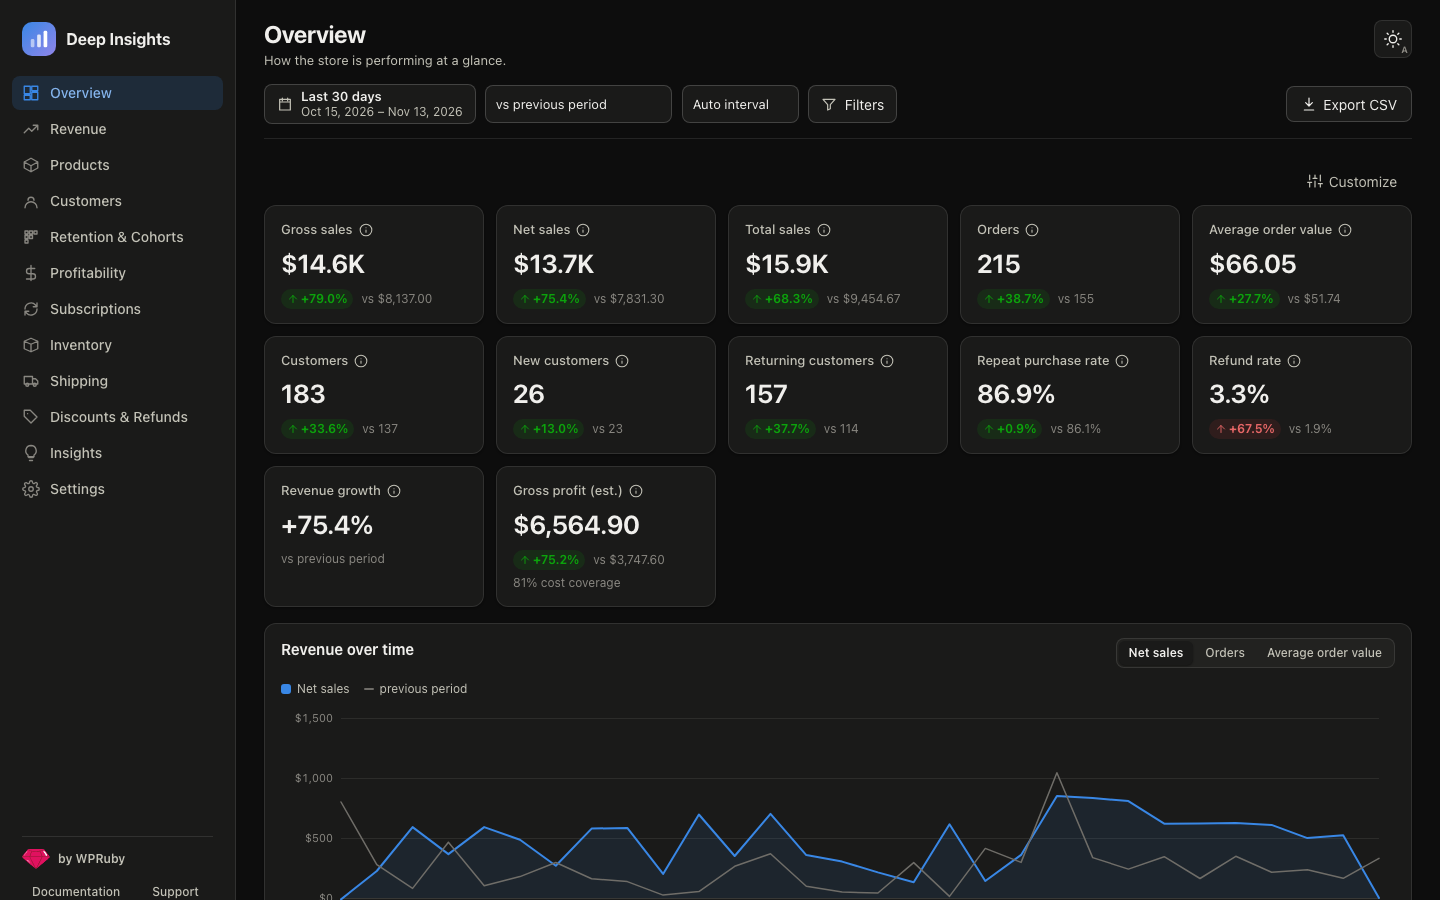
Light and dark mode
The button in the top-right corner switches between automatic (follows your system), dark and light themes.
Tables and chart data
- Click a column heading to sort a table.
- Use the search box above a table to find a row.
- Under each chart, Show data table reveals the exact numbers behind it.
- Hover over the info icon next to a metric to see how it is calculated. How these numbers are calculated at the bottom of a report explains its method.
Export to CSV
Click Export CSV to download the report you are viewing, with the current dates and filters. Exports include every row, even when a table on screen shows only the top results.
Customer-level exports (Customers and RFM segments) need the Manage WooCommerce capability.