WooCommerce tells you how much you sold. It is much harder to see who comes back after their first order, which products are quietly losing steam, what you actually earn on each sale, or why this month looks different from the last.
Today we’re releasing Deep Insights for WooCommerce, a free plugin that answers those questions inside your WordPress admin. It turns the orders you already have into clear reports on revenue, products, customers, retention, profit, subscriptions, inventory, shipping, discounts and refunds.
It’s free, it needs no license key, and your data never leaves your site.
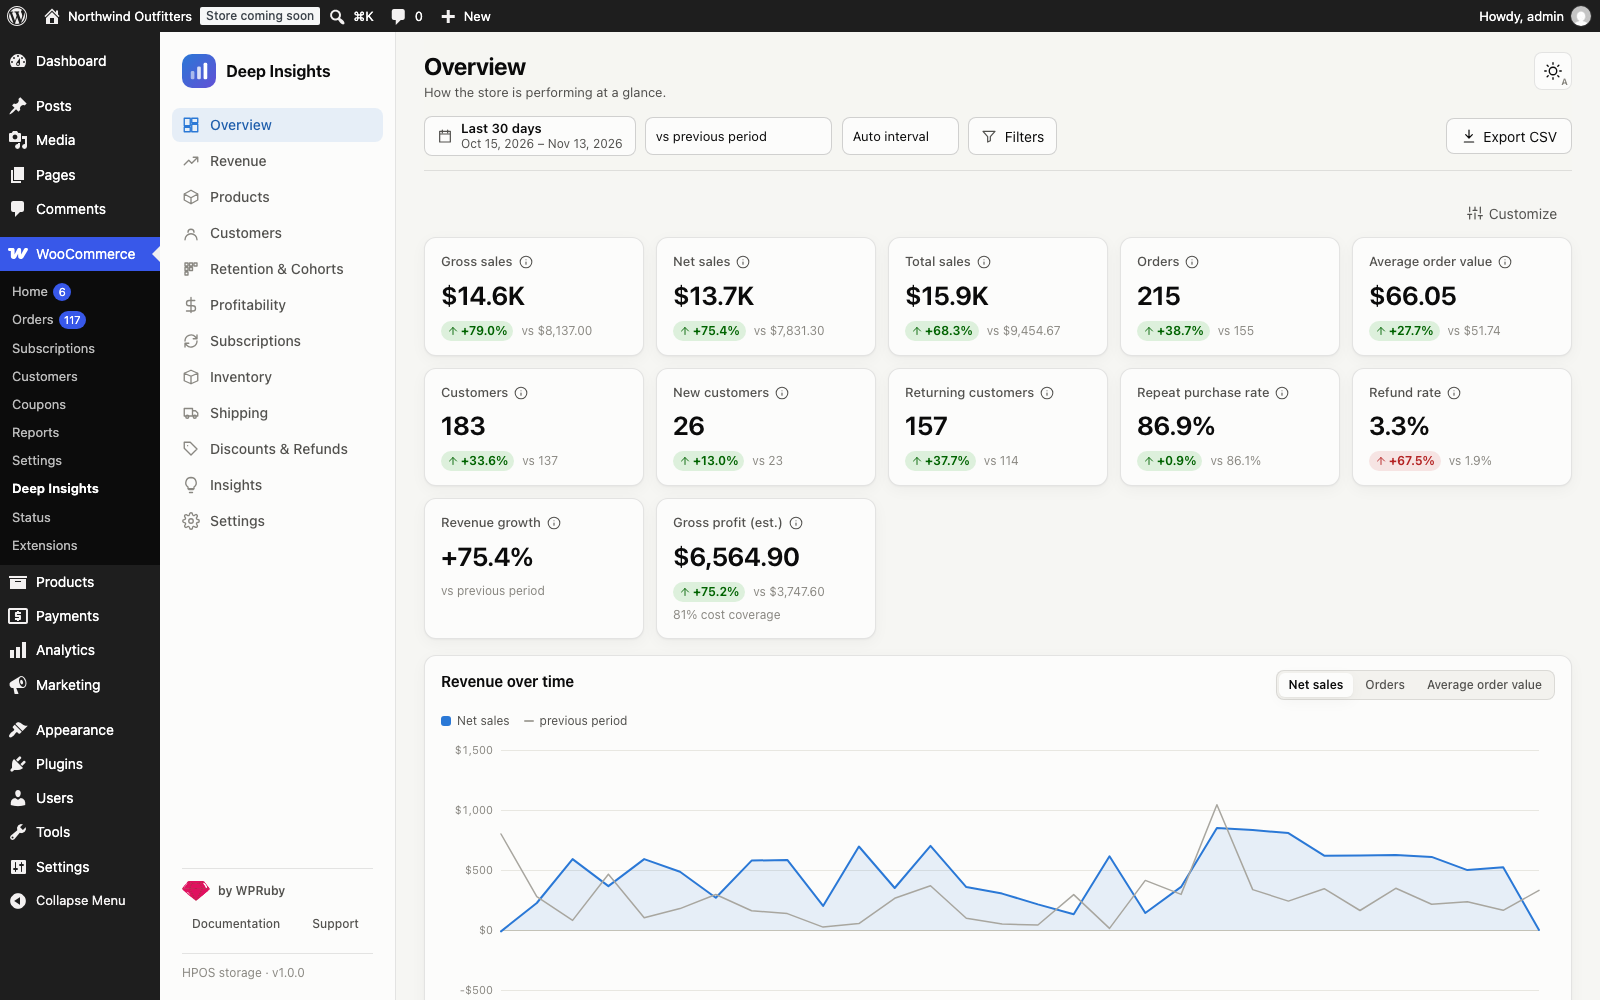
Everything in one dashboard
Open WooCommerce → Deep Insights and you get a fast dashboard with a report for every part of your store:
- Overview: the numbers that matter at a glance, compared with the previous period
- Revenue: from gross sales to total sales, and where your revenue comes from
- Products: performance by product, variation and category, plus products bought together
- Customers: new vs returning, lifetime revenue, geography and traffic sources
- Retention & Cohorts: do customers come back after their first order?
- Profitability: gross profit from the product costs you record
- Subscriptions: recurring revenue, churn and renewals
- Inventory: stock levels, sales speed and estimated sell-out dates
- Shipping, Discounts & Refunds, and an Insights page that explains what changed
Every report shares the same date range, comparison and filters. Filter by product, category, country, payment gateway, shipping method, order status, customer type or customer segment, then export what you see to CSV.
Get to know your customers
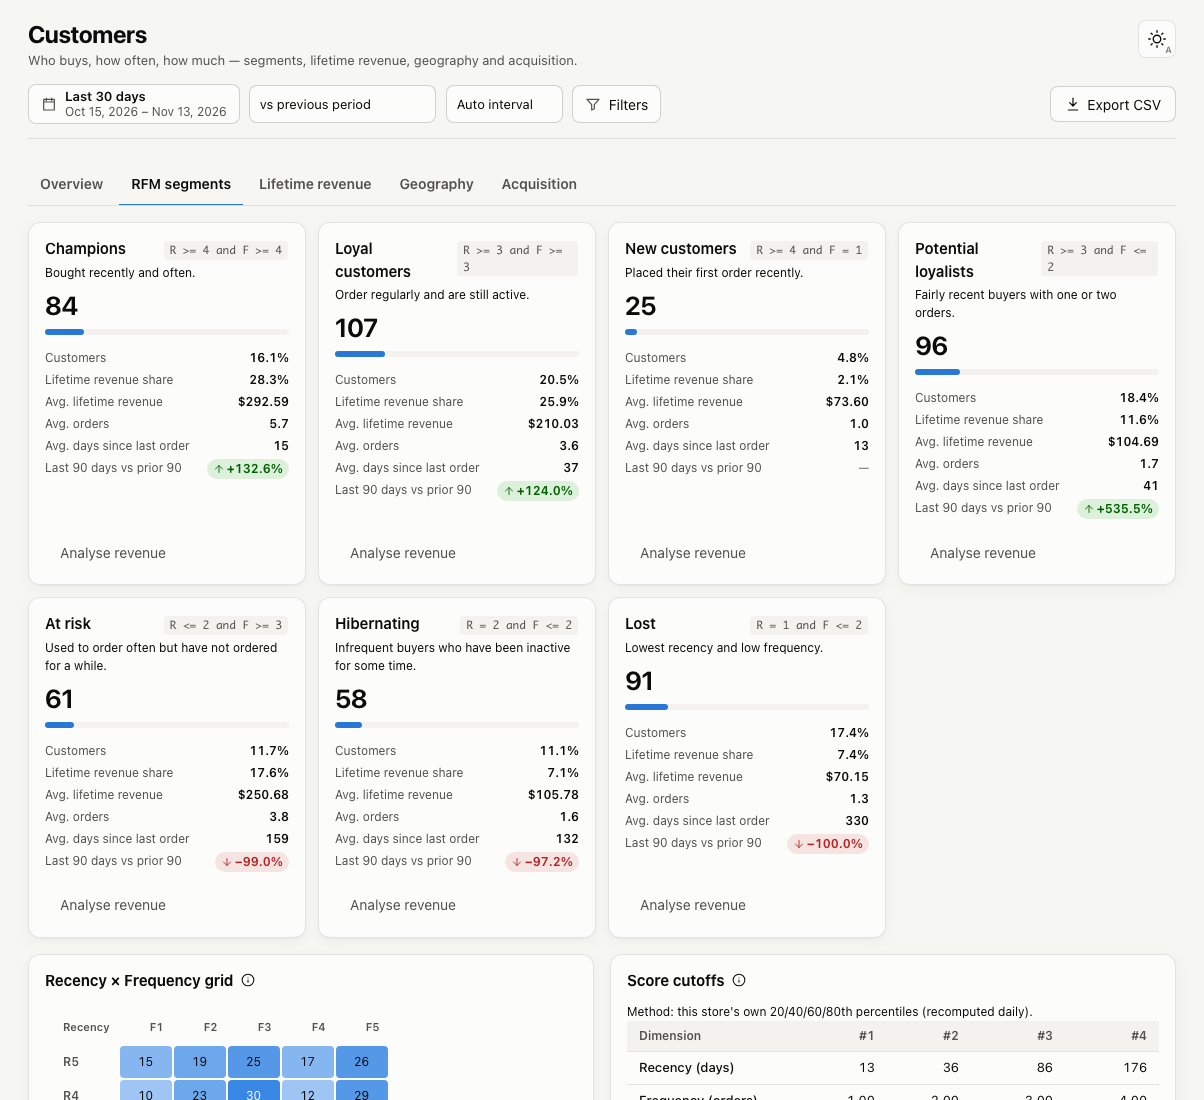
Deep Insights groups your customers by how recently, how often and how much they buy. You’ll see your Champions, your Loyal customers, the New ones, and the customers who are At risk of drifting away, along with how much each group spends.
Click Analyse revenue on any segment to see what that group buys. Or filter any report by segment, for example to see which products your best customers order.
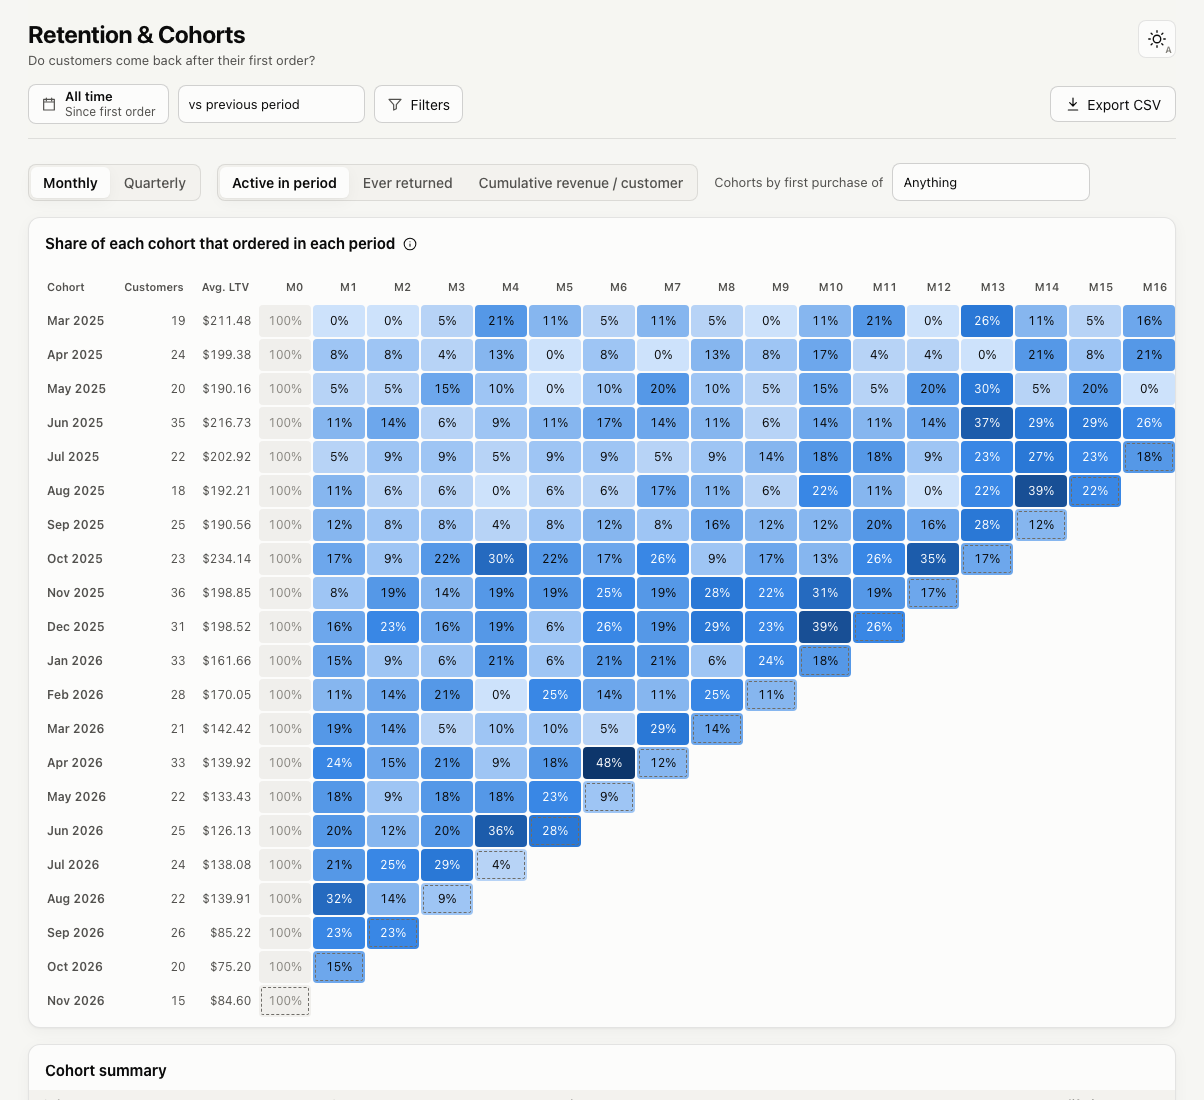
The Retention & Cohorts report shows how many customers come back in the months after their first order. Lifetime revenue shows what a customer is worth over time, which countries, products and traffic sources bring your most valuable customers, and how much of your revenue comes from your top 1%, 5%, 10% and 20% of customers.
See which products are rising and which are fading
The Products report goes beyond best-sellers:
- Bought together shows which products end up in the same orders, so you can plan bundles and cross-sells.
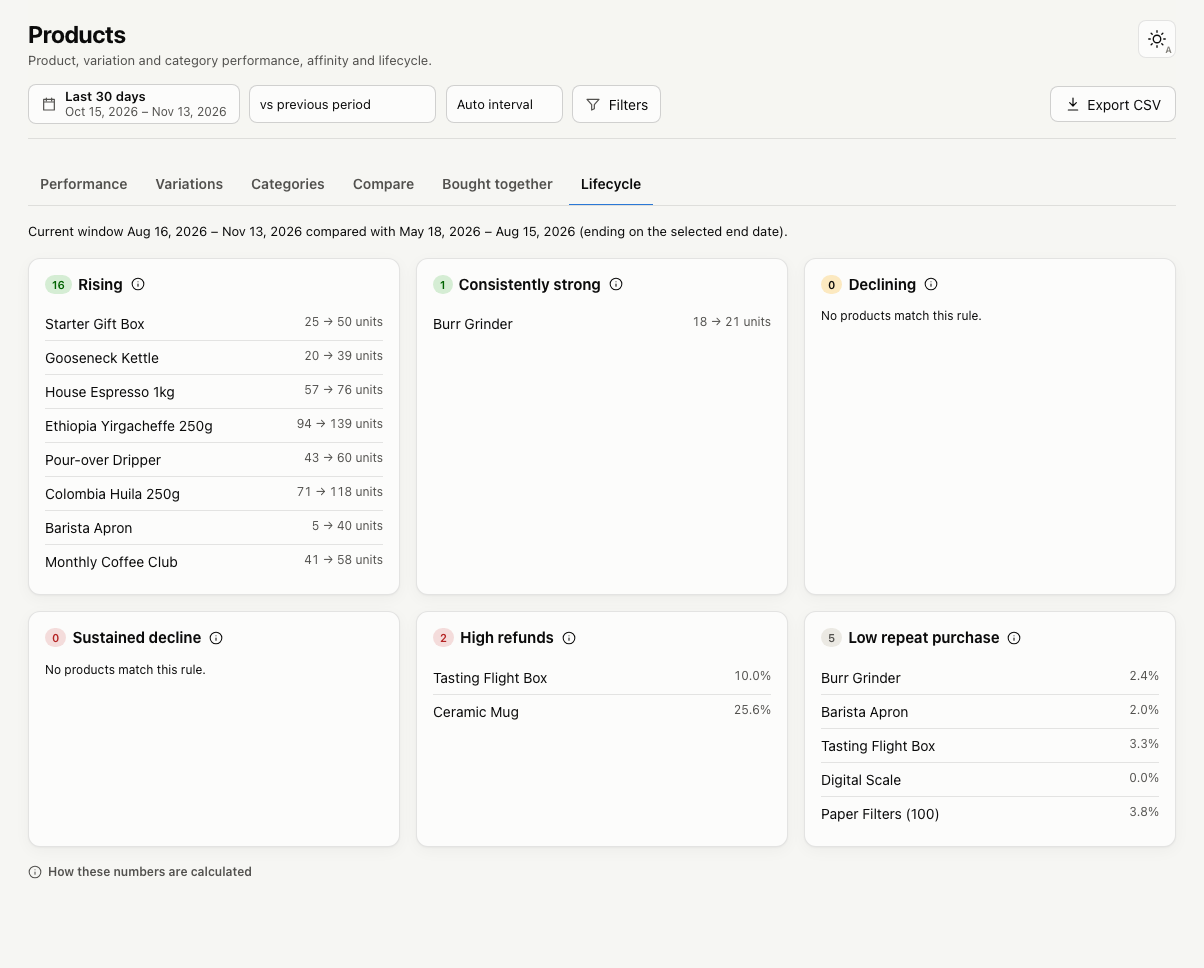
- Lifecycle sorts products into simple groups: rising, consistently strong, declining, in sustained decline, with high refunds, or rarely bought again.
- Compare puts up to six products side by side over time.
Know your real margins
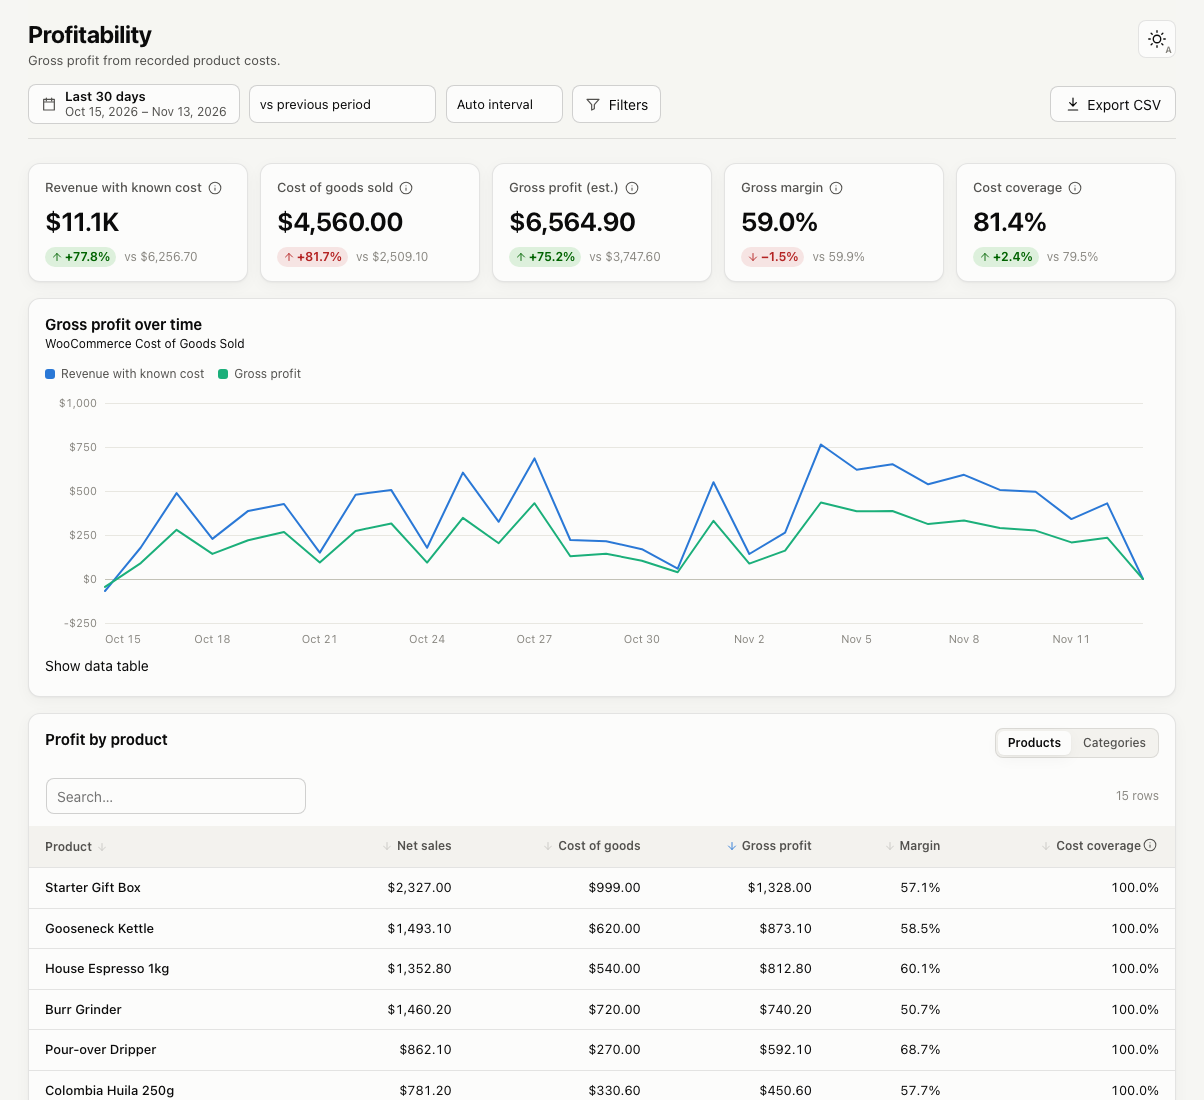
If you record product costs with WooCommerce’s built-in Cost of Goods Sold feature, the Profitability report shows gross profit and margin for your store, each product and each category.
Deep Insights never guesses a cost. Order lines without a recorded cost are left out, and the report shows exactly how much of your revenue has cost data. The figures you see are real, not estimates.
Insights that explain what changed
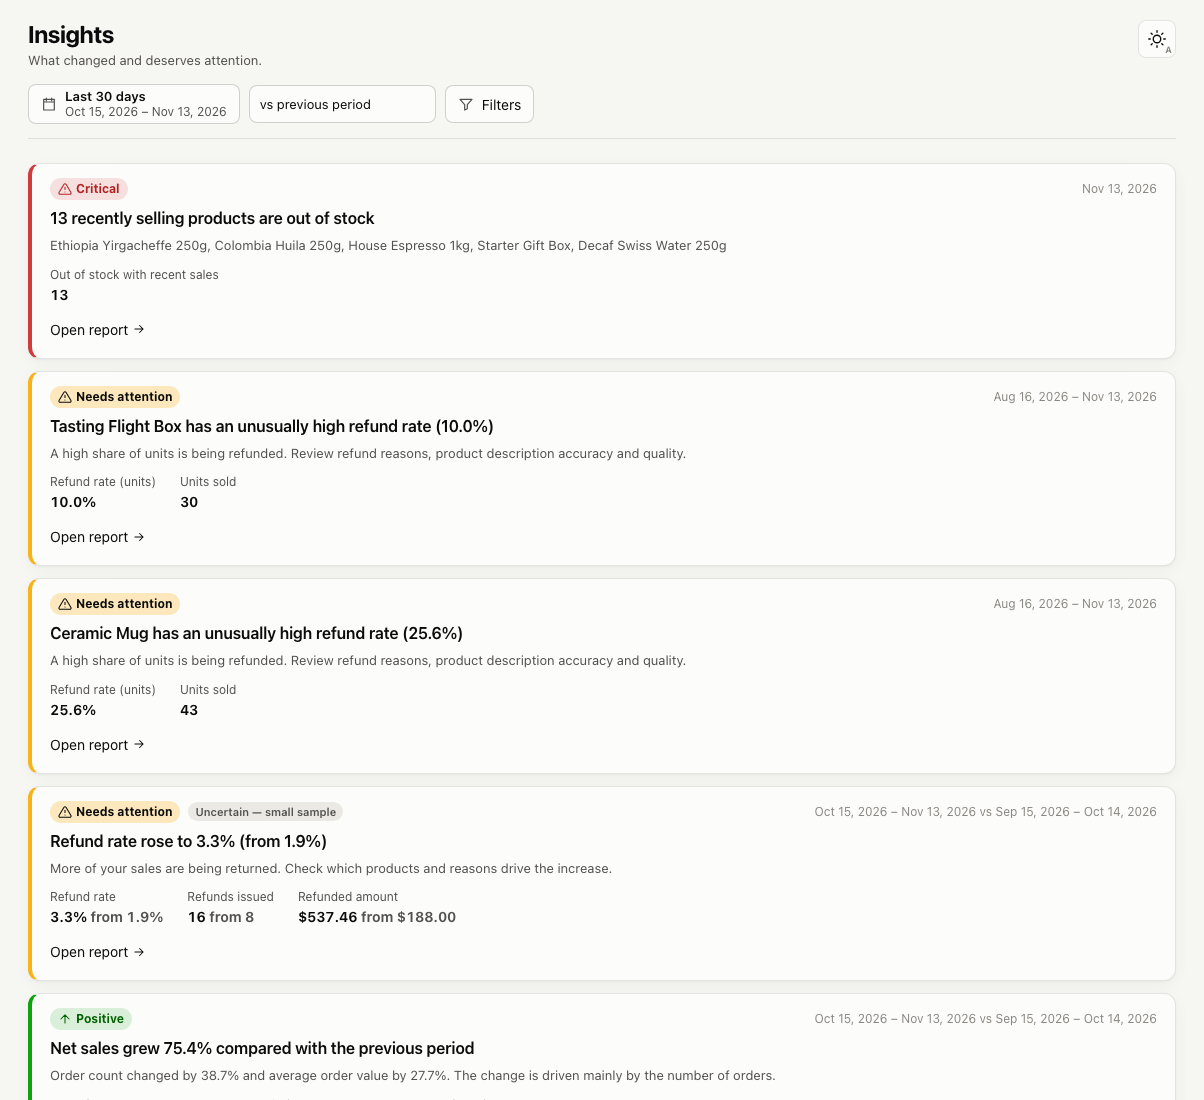
The Insights page checks your store against a set of simple rules and tells you what deserves your attention: a jump in refunds, a product in steady decline, best-sellers about to run out of stock, customers coming back less often, or one product making up a large share of your revenue.
Each insight shows the numbers behind it and the periods it compared. If a change could just be chance, because there are only a few orders, it’s marked as uncertain. There’s no AI and no guesswork, just rules you can read.
Numbers you can trust
Revenue in Deep Insights uses the same definitions as WooCommerce Analytics. With the same dates and settings, orders, sales, refunds, taxes and shipping match to the cent, and automated tests check that they do.
Every metric has an info icon that explains how it’s calculated, and each report has a How these numbers are calculated note.
Your data stays on your server
Deep Insights is fully self-hosted. There are no accounts, no API keys and no external services, and no store or customer data is ever sent anywhere.
It’s also read-only. It never changes your orders, products, customers, refunds, subscriptions or stock. Its analytics tables store no names, emails, addresses or payment details, and it works with WordPress’s privacy export and erase tools.
Built for busy stores
Deep Insights imports your order history in the background, in small batches, so it doesn’t slow your store down. New orders are picked up automatically. Reports are cached and refreshed in the background, so the dashboard stays quick. We benchmarked it with a million orders.
It works with both High-Performance Order Storage (HPOS) and the classic order storage, and with WooCommerce Subscriptions.
Free, with updates from WordPress
Deep Insights for WooCommerce is free. There’s no license key to enter, and new versions arrive through Dashboard → Updates like any other plugin.
You’ll need WordPress 6.4, WooCommerce 8.2 and PHP 7.4 or later. The documentation walks through every report and setting.